library(Canek)

# Functions
## Function to plot the pca coordinates
plotPCA <- function(pcaData = NULL, label = NULL, legPosition = "topleft"){
  col <- as.integer(label)
  plot(x = pcaData[,"PC1"], y = pcaData[,"PC2"],
       col = as.integer(label), cex = 0.75, pch = 19,
       xlab = "PC1", ylab = "PC2")
  legend(legPosition,  pch = 19,
         legend = levels(label),
         col =  unique(as.integer(label)))
}
Load the data
On this toy example we use the two simulated batches included in the
SimBatches data from Canek’s package.
SimBatches is a list containing:
-
batches: Simulated scRNA-seq datasets with genes (rows) and cells (columns). Simulations were performed using Splatter. -
cell_type: a factor containing the celltype labels of the batches
lsData <- list(B1 = SimBatches$batches[[1]], B2 = SimBatches$batches[[2]])
batch <- factor(c(rep("Batch-1", ncol(lsData[[1]])),
                  rep("Batch-2", ncol(lsData[[2]]))))
celltype <- SimBatches$cell_types
table(batch)
#> batch
#> Batch-1 Batch-2
#>     631     948
table(celltype)
#> celltype
#> Cell Type 1 Cell Type 2 Cell Type 3 Cell Type 4
#>        1451          53          38          37
PCA before correction
We perform the Principal Component Analysis (PCA) of the joined datasets and scatter plot the first two PCs. The batch-effect causes cells to group by batch.
plotPCA(pcaData = pcaData, label = batch, legPosition = "bottomleft")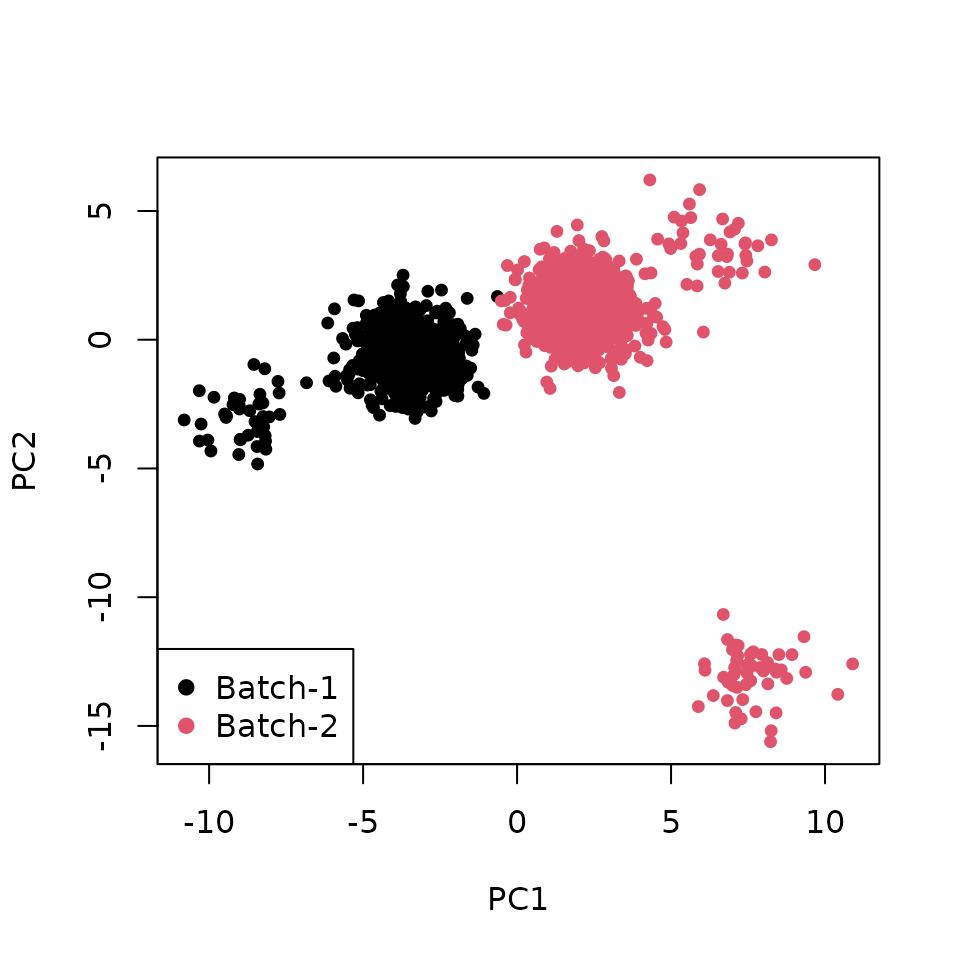
plotPCA(pcaData = pcaData, label = celltype, legPosition = "bottomleft")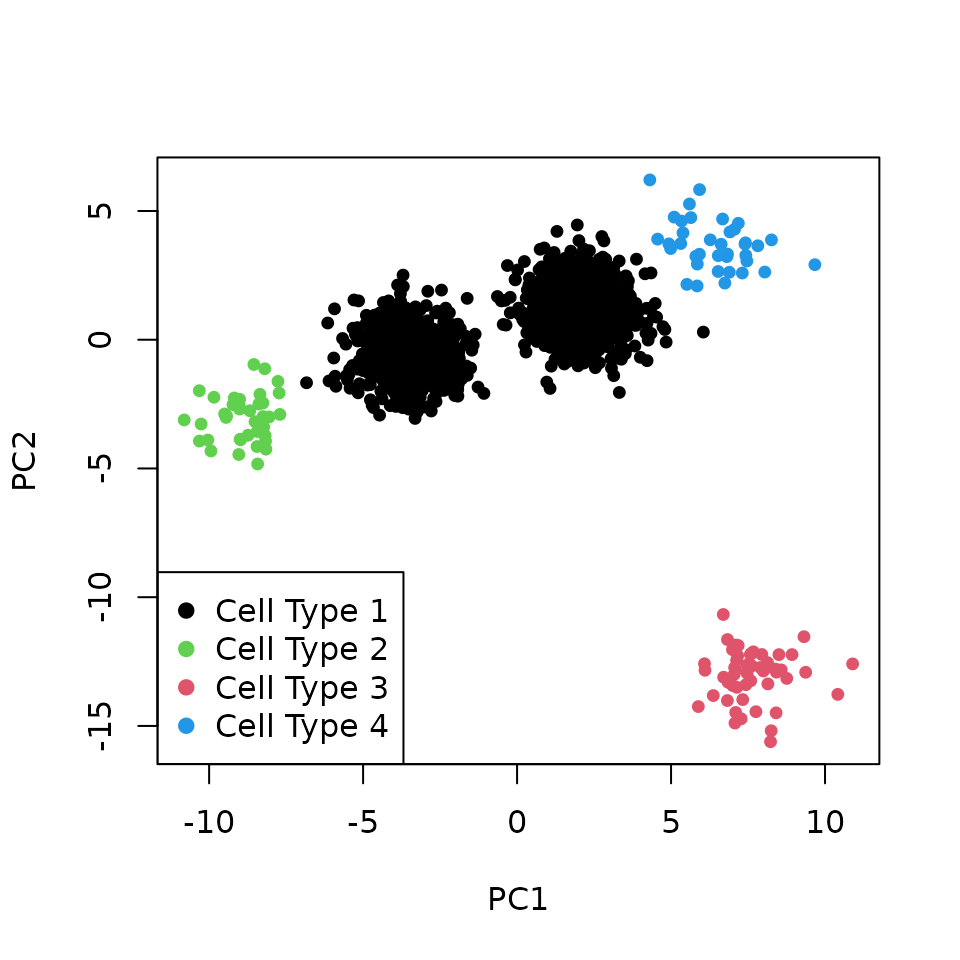
Run Canek
We correct the toy batches using the function RunCanek. This function accepts:
- List of matrices
- Seurat object
- List of Seurat objects
- SingleCellExperiment object
- List of SingleCellExperiment objects
On this example we use the list of matrices created before.
data <- RunCanek(lsData)PCA after correction
We perform PCA of the corrected datasets and plot the first two PCs. After correction, the cells group by their corresponding cell type.
plotPCA(pcaData = pcaData, label = batch, legPosition = "topleft")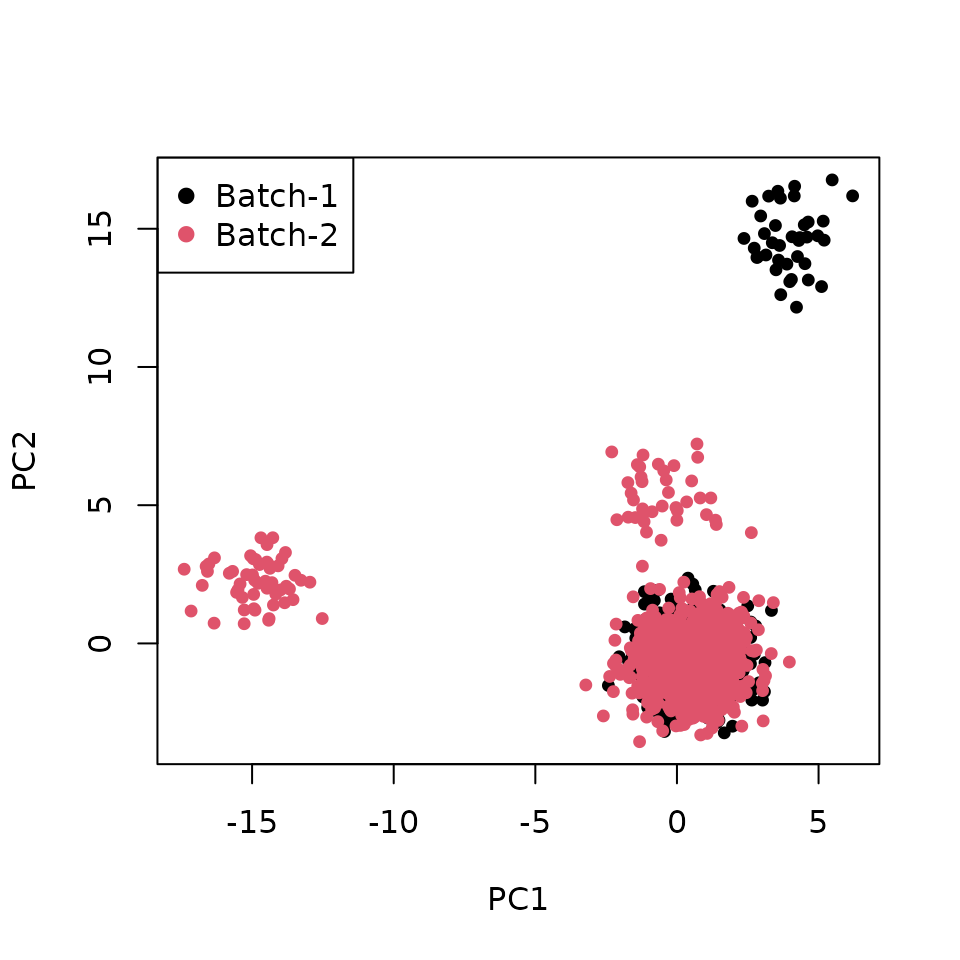
plotPCA(pcaData = pcaData, label = celltype, legPosition = "topleft")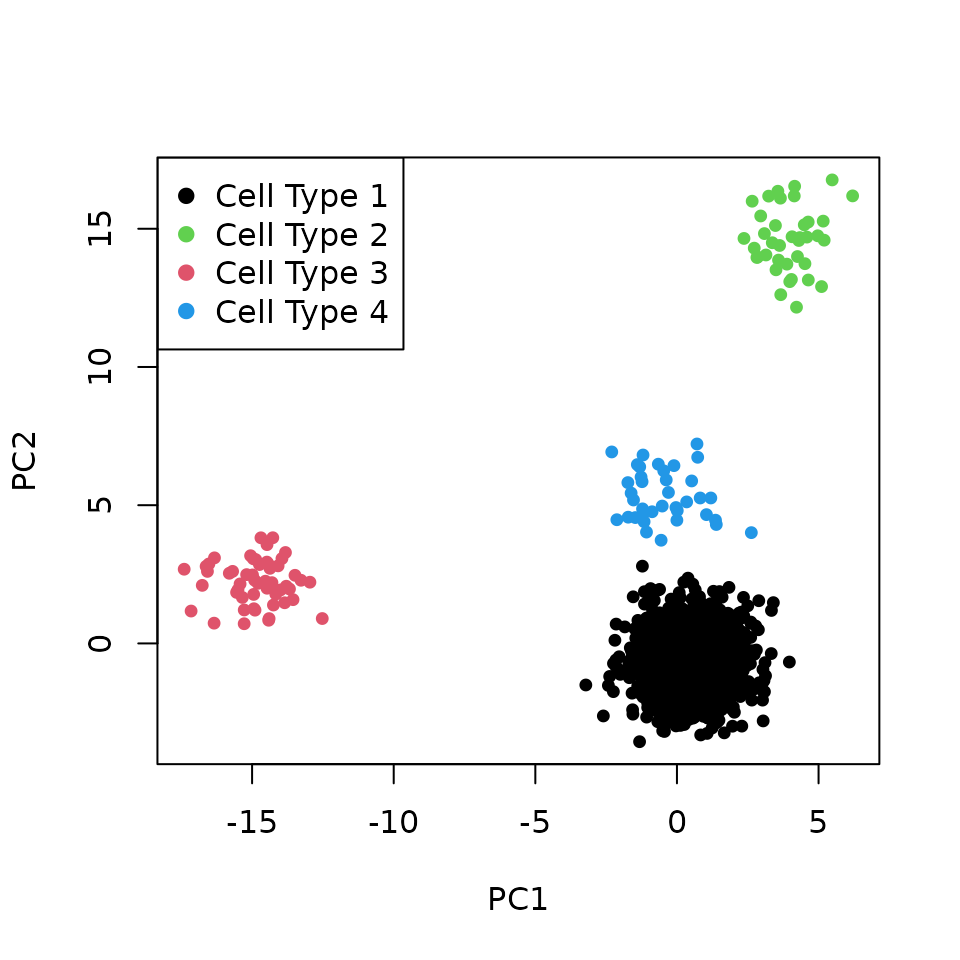
Session info
sessionInfo()
#> R version 4.6.1 (2026-06-24)
#> Platform: x86_64-pc-linux-gnu
#> Running under: Ubuntu 24.04.4 LTS
#>
#> Matrix products: default
#> BLAS:   /usr/lib/x86_64-linux-gnu/openblas-pthread/libblas.so.3
#> LAPACK: /usr/lib/x86_64-linux-gnu/openblas-pthread/libopenblasp-r0.3.26.so;  LAPACK version 3.12.0
#>
#> locale:
#>  [1] LC_CTYPE=C.UTF-8       LC_NUMERIC=C           LC_TIME=C.UTF-8
#>  [4] LC_COLLATE=C.UTF-8     LC_MONETARY=C.UTF-8    LC_MESSAGES=C.UTF-8
#>  [7] LC_PAPER=C.UTF-8       LC_NAME=C              LC_ADDRESS=C
#> [10] LC_TELEPHONE=C         LC_MEASUREMENT=C.UTF-8 LC_IDENTIFICATION=C
#>
#> time zone: UTC
#> tzcode source: system (glibc)
#>
#> attached base packages:
#> [1] stats     graphics  grDevices utils     datasets  methods   base
#>
#> other attached packages:
#> [1] Canek_0.3.1
#>
#> loaded via a namespace (and not attached):
#>  [1] sass_0.4.10         generics_0.1.4      robustbase_0.99-7
#>  [4] class_7.3-23        lattice_0.22-9      numbers_0.9-2
#>  [7] digest_0.6.39       magrittr_2.0.5      evaluate_1.0.5
#> [10] grid_4.6.1          fastmap_1.2.0       jsonlite_2.0.0
#> [13] Matrix_1.7-5        nnet_7.3-20         mclust_6.1.3
#> [16] kernlab_0.9-33      codetools_0.2-20    modeltools_0.2-24
#> [19] textshaping_1.0.5   jquerylib_0.1.4     cli_3.6.6
#> [22] rlang_1.3.0         BiocNeighbors_2.6.0 cachem_1.1.0
#> [25] yaml_2.3.12         otel_0.2.0          fpc_2.2-14
#> [28] FNN_1.1.4.1         tools_4.6.1         flexmix_2.3-20
#> [31] parallel_4.6.1      BiocParallel_1.46.0 BiocGenerics_0.58.1
#> [34] R6_2.6.1            matrixStats_1.5.0   stats4_4.6.1
#> [37] lifecycle_1.0.5     S4Vectors_0.50.1    fs_2.1.0
#> [40] htmlwidgets_1.6.4   bluster_1.22.0      MASS_7.3-65
#> [43] irlba_2.3.7         ragg_1.5.2          cluster_2.1.8.2
#> [46] pkgconfig_2.0.3     desc_1.4.3          pkgdown_2.2.1
#> [49] bslib_0.11.0        Rcpp_1.1.2          systemfonts_1.3.2
#> [52] DEoptimR_1.2-0      xfun_0.60           prabclus_2.3-5
#> [55] knitr_1.51          htmltools_0.5.9     igraph_2.3.3
#> [58] rmarkdown_2.31      compiler_4.6.1      diptest_0.77-2